
This article didn't surprise me at all..When I search for properties for my buyers, a good percentage of them are either short sales or foreclosures. In order for market values to start increasing, these distressed properties have to get sold..it's a tough situation for sellers but for buyers, it can be the deal of a lifetime.
RISMEDIA, February 24, 2011—RealtyTrac, a leading online marketplace for foreclosure properties, released its Year-End and Q4 2010 U.S. Foreclosure Sales Report, which shows that foreclosure homes accounted for nearly 26% of all U.S. residential sales during the year, down from 29% of all sales in 2009 but up from 23% of all sales in 2008. The report also shows that the average sales price of these foreclosure properties was more than 28% below the average sales price of properties not in the foreclosure process—up from a 27% average discount in 2009 and a 22% average discount in 2008.
A total of 831,574 U.S. residential properties either owned by banks or in some stage of foreclosure—default or scheduled for auction—sold to third parties in 2010, a decrease of 31% from 2009 and a decrease of nearly 14% from 2008. Meanwhile, sales volume of non-foreclosure properties in 2010 decreased nearly 19% from 2009 and nearly 27% from 2008.
A total of 149,303 foreclosure sales were recorded in the fourth quarter, down 22% from the previous quarter and down 45% from the fourth quarter of 2009—despite a 21% monthly uptick in foreclosure sales volume in December. Mirroring the year-end statistics, foreclosure sales in the fourth quarter accounted for 26% of total sales, and foreclosure properties sold for an average sales price that was 28% below the average sales price of properties not in foreclosure.
“Foreclosure sales in the fourth quarter faced the twin headwinds of the expired home buyer tax credit—which began to stifle sales volume during the third quarter—and the foreclosure documentation controversy, which hit in the fourth quarter and temporarily froze sales of foreclosures from several major lenders,” said James J. Saccacio, chief executive officer of RealtyTrac. “Given those factors, it’s not surprising that in the fourth quarter foreclosure sales volume hit its lowest level since the first quarter of 2008.
“Still, foreclosures continue to represent a substantial percentage of all U.S. residential sales and continue to sell at an average sales price that is significantly below the average sales price of properties not in foreclosure—the result of a bloated supply of foreclosures and weak demand from home buyers,” Saccacio continued. “The catch-22 for 2011 is that while accelerating foreclosure sales will help clear the oversupply of distressed properties and return balance to the market in the long run, in the short term a high percentage of foreclosure sales will continue to weigh down home prices.”
Foreclosure sales by type
A total of 512,886 bank-owned (REO) properties sold to third parties in 2010—down nearly 32% from 2009—at an average discount of 36%, up from an average discount of 33% in 2009. REO sales accounted for 16% of all sales in 2010, down from nearly 18% of all sales in 2009 but still higher than the 13% of all sales they accounted for in 2008.
In the fourth quarter, a total of 95,683 REO properties sold to third parties, down 17% from the third quarter and down 43% from the fourth quarter of 2009. Fourth quarter REO sales accounted for nearly 17% of all sales during the quarter at an average discount of nearly 37%.
A total of 318,688 pre-foreclosure properties—in default or scheduled for auction—sold to third parties in 2010, down nearly 30% from 2009. Pre-foreclosure properties in 2010 sold at an average discount of 15%, down from an average discount of nearly 17% in 2009. Pre-foreclosure sales accounted for nearly 10% of all sales in 2010, down from nearly 11% of all sales in 2009 and virtually the same percentage of sales as in 2008.
In the fourth quarter, a total of 53,620 pre-foreclosure properties sold to third parties, down 29% from the previous quarter and down 49% from the fourth quarter of 2009. Fourth quarter pre-foreclosure sales accounted for nearly 10% of all sales during the quarter at an average discount of nearly 13%.
Nevada, Arizona, California post highest percentage of foreclosure sales in 2010
Foreclosure sales accounted for 57% of all residential sales in Nevada in 2010, the highest percentage of any state, but still down from a peak of 67% of all sales in 2009. Fourth quarter foreclosure sales accounted for nearly 59% of all sales in the state, up from nearly 54% in the third quarter.
Arizona foreclosure sales accounted for 49% of all sales in 2010, the second highest of any state but down from a peak of 54% in 2009. Fourth quarter foreclosure sales accounted for 55% of all sales in the state, up from 46% in the third quarter.
California foreclosure sales accounted for 44% of all sales in 2010, the third highest of any state but also down from a peak of 57% in 2009. Fourth quarter foreclosure sales in California accounted for 45% of all sales, up from 40% in the third quarter.
Other states where foreclosure sales accounted for at least one-quarter of all sales in 2010 were Florida (36%), Michigan (33%), Georgia (29%), Idaho (28%), Oregon (28%), Illinois (26%), Virginia (25%) and Colorado (25%).
10 states post foreclosure discounts of more than 35 percent in 2010
Ohio foreclosures sold for an average discount of nearly 43% in 2010, down from an average discount of nearly 47% in 2009, but still the highest of any state. Kentucky foreclosures sold for an average discount of more than 40% in 2010, the second highest of any state and up from nearly 38% in 2009.
Eight other states posted average foreclosure sale discounts of 35% or more in 2010: Tennessee, California, Pennsylvania, Illinois, New Jersey, Michigan, Georgia and Wisconsin.
Thursday, February 24, 2011
Existing-Home Sales Rise Again in January
With the holidays behind us, I can already see the real estate market activity picking up here in the Tidewater area. The phones are ringing again!!!
The uptrend in existing-home sales continues, with January sales rising for the third consecutive month with a pace that is now above year-ago levels, according to the National Association of REALTORS®.
http://www.realtor.org/press_room/news_releases/2011/02/january_above
The uptrend in existing-home sales continues, with January sales rising for the third consecutive month with a pace that is now above year-ago levels, according to the National Association of REALTORS®.
http://www.realtor.org/press_room/news_releases/2011/02/january_above
Monday, January 31, 2011
Buy! Don't Rent!
It's a great time to buy a house. Interest rates are still incredibly low and available homes are abundant. Personally, I can see the market is improving and business has really picked up. What great news!
A lender sent this article to me today and thought I'd share.
Homeownership Makes $ense
Bring on the buyers! At last, the housing market is beginning to make sense again. The ownership line is finally crossing over the rental line on the great Homeownership graph.
It is now more expensive to rent than to buy a home in 72% of major metropolitan areas across the US, according to the Trulia Rent vs. Buy Index released Monday.
This is due to rising demand for rentals and falling home prices combined with low interest rates.
Pete Flint, chief executive and co-founder of Trulia says: "Since the start of the Great Recession, many former homeowners have flooded the rental market… Following the principles of supply and demand, renting has become relatively more expensive than buying in most markets."
The index compared the median list price and rent paid for a two-bedroom home in 50 cities. It then assigned a price-to-rent ration to each city with 15 signifying a buyer's market and 21 or more signifying a renter's market. The space between the two numbers signifies a balanced market.
The cost to rent includes rent and insurance. The cost of ownership includes mortgage principal and interest, closing costs, property taxes, hazard insurance and any homeowner association dues.
Not surprising, the most affordable markets are Las Vegas and Miami where the price-to-rent ration is 6 and where the foreclosure rates have topped the charts. Las Vegas was atop the foreclosures list in Q3 with one in every 25 homes was in foreclosure.
The index reported that homeownership was cheaper in the metro areas of San Francisco, Seattle, New York and Kansas City, MO, all of whom had price-to-rent ratios over 21.
Other metros like Oakland, Sacramento, Los Angeles, Miami and Phoenix are experiencing elevated rates of unemployment or foreclosures and close economic centers with projected job growth are still more affordable to renters.
This is truly great news for the Housing Industry.
Monday, January 10, 2011
Foreclosure and Short Sale Consequences
Foreclosure is an extreme measure when an owner is "upside down" on their mortgage. It should be the last resort when you are unable to make your mortgage payments as the consequences can stick with you for many years. This is a wonderful article describing foreclosure and short sales.
Consequences of Defaults and Foreclosures
by Carla Hill
The economy has put a strain on thousands of households across the nation. In these tough times, many homeowners are struggling in the face of foreclosure. What are the consequences of defaulting on your loan? And what can you do to prevent this loss?
One of the most startling impacts of a foreclosure appears on one's credit report. Your credit score may plummet by 200 to 300 points. In this economic climate, where credit lending standards are already tightened, you may then find it difficult to do everything from buying a car to renting an apartment. What's worse is that the notation of foreclosure stays on your report for up to seven years.
Next, you may owe the lender money. They backed a loan on a home worth X amount. If they sell your home at foreclosure for less than that amount, you may be responsible for the difference. Many states have laws protecting you against this action, but speak with an attorney to find out for what you may be liable.
Lately, after the sudden drop in property values in certain markets, investors have been guilty of strategic defaults. This is when an investor purposely defaults on a property, because the time it will take for them to recoup their money is perceived as too great. A word to the wise: courts are now ordering deficiency judgements in some cases, where the investor must pay the lender back their losses.
There really is no winner in a foreclosure. With homeownership comes increased family stability. The loss of a home can be a trying time on all members of the family. Beyond your own family, a foreclosure can mean lowered property values for your entire neighborhood.
Avoiding default and foreclosure is not always possible. If you are not able to make your payments, be sure to be honest with your lender. They may be able to present you with an alternative. In addition, here are a few tips to get you thinking.
1. Short Sale. A short sale occurs when a borrower is unable to pay their mortgage loan. Both the homeowner and lender consent to a short sale, which means selling the home at a moderate loss, avoiding foreclosure and its associated frees and havoc on credit reports.
2. Talk to your lender. They may be able to offer you programs, refinancing, or counseling that can help you avoid losing your home. Most banks don't want you to foreclose, as it would mean they take a loss.
3. Selling if not underwater. If you are not underwater on your home loan, meaning you don't owe more than you can sell for and owe, then now is the time to employ a real estate agent and get your home sold. Downsizing or even renting is a better option than ruining your credit for the next seven years.
4. Budgeting. There are non-necessities that can be cut out of your expenses. Cut down and live as simply as possibly. You may have more money than you realized!
5. Financial counseling. Defaulting is serious business. You would be wise to meet with a financial counselor to see if they can help you avoid losing your home.
6. Refinancing or loan modification. Your bank or lender may be willing to allow you to refinance. This can translate into lower monthly payments.
The bottom line is this. Defaulting on your mortgage has severe consequences. Try your best to balance finances before your mortgage becomes an issue. And be honest and upfront with your lender in the event that a default is likely.
Published: January 6, 2011
Thursday, December 23, 2010
"Pending Sales Are Up"
Finally! On the uptrend, pending sales increased in October since bottoming in June, according to the National Association of REALTORS.
A "pending" or "under contract" sale, is a real estate sale that is non-contingent (ex: home inspection contingency removed)and is moving forward to closing.
Read more about this at
http://www.realtor.org/press_room/news_releases/2010/12/strong_phs
Happy Holidays Everyone! Have a happy, healthy and prosperous new year!
Tuesday, November 23, 2010
Holiday closings in South Hampton Roads
I'd like to wish everyone a wonderful Thanksgiving!
http://hamptonroads.com/2010/11/holiday-closings-south-hampton-roads?cid=srch
http://hamptonroads.com/2010/11/holiday-closings-south-hampton-roads?cid=srch
Sunday, November 21, 2010
Tax Credit Effects on the Real Estate Market
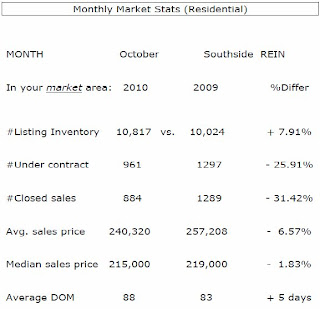
Last year's tax credit encouraged many buyers that were "sitting on the fence" to go ahead and purchase a new home. Here are the market stats for the month of October as it compares to this time last year.
REIN reports
Effects of ’09 Tax Credit Starting to Show
(Virginia Beach, Virginia – November 8, 2010)
The effects from the residential sales surge experienced in the third and fourth quarters of 2009 are now starting to be more prominent in 2010 sales totals comparisons. Traditionally, the third and fourth quarters are slower when compared to the second quarter of the year. But, in 2009 the third quarter had the highest sales total and the fourth quarter was almost equal to the second. This shift in buyers’ habits was due in large part to the federal tax credit. It caused many people who were potential buyers in the first and second quarters of 2010 to buy in the third and fourth quarters of 2009 prior to the original tax credit expiration of November 30. This date set a line in the sand for home buyers and the following extension allowed even more buyers to move their own purchase timelines to earlier dates thus “pulling forward” home sales activity. Many people across the country bought homes sooner than planned specifically for the tax credit and skewed many settled sales totals prior to the credit’s expiration.
The number of active homes for sale in the region last month remained high and increased by 8.95% when compared to October 2009. The recent levels of homes for sale have been the highest recorded for each month since February 2010. The region has maintained a level above 15,000 available listings for seven straight months, also the most on record. However, the median listing price of homes on the market in October 2010 declined by 9% when compared to October 2009. This drop is in line with the settling of home prices in Hampton Roads and is a potential sign of housing stability.
The number of under contract residential sales fell year-over-year by 28% in October. This statistic, often referred to as a leading market indicator, does not provide a very positive outlook for the near future. Most of the recent downturn in under contract may be attributed to the expiration of the federal tax credit, but other factors are also influencing the rapid drop in transactions including availability of credit and consumer expectations.
Residential settled sales plunged 32.4% in October when compared to the same time last year. The plummet was the largest year-over-year drop since January 2009, -35%. Each of the seven major cities in the area experienced sales declines ranging from a low of -21% in Norfolk to the high of -46% in Newport News. The median sales price for October 2010 was down 1.2% when compared to October 2009. The median price for homes sold seems to have bottomed for the region with its continued small differences as recorded each month. Some areas, including Virginia Beach, Chesapeake, and James City County, are starting to experience price appreciation with each area up 1% year-over-year.
The months’ supply of inventory held at ten months, but the absorption rate, the average number of homes sold over the past twelve months, continued to decline and is now at 1,480 homes per month.
The percentage of distressed listings, those that are bank owned or short sales, expanded to account for 22% of the active homes for sale and they comprised 31.7% of the settled sales total. October was, by far, the most prevalent month for distressed sales activity in our region since the housing bubble burst. Current market conditions and the overall economy do not show signs of a dramatic decrease in distressed listings. If these trends, both percent of active and sold listings, continue upward home prices within the region may decline as a result of the downward pressure these distressed homes have on local markets.
Subscribe to:
Comments (Atom)